FCIS
Fluorescence colorimetric in situs
Based on Zhou, X. and Vize, P.D. (2004). Developmental Biology 271: 322-338.
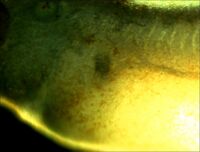
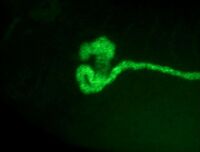
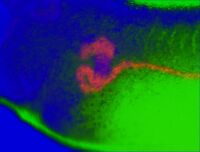
A combination of standard BM purple staining along with a FITC-tyramide or Cy3-tyramide counterstain. The purple precipitate will mask the fluorescence, and the masking shows where your expression is located. For example, compare the images of kidneys stained with XAA1, which is only active in a tiny part of the pronephros. On its own this would be difficult to interpret. The middle panel shows a general pronephric FISH counterstain (sodium potassium ATPase), and the right panel an overlay. Click on the images to enlarge. From the FCIS image the localized pronephric expression is very obvious.
FCIS has the advantage that it works with a stereoscope and standard reagents.


As the images show, the purple and fluorescent images can be effectively overlayed to highlight regions of expression and co-expression. Strong expression of the BM purple appears blue, weaker and overlapping expression pink, and FITC only orange.
Hybridize two probes labeled with different haptens simultaneously (e.g. XAA1-DIG and NaK ATPase-FITC) via the standard protocol. DNP labeled RNA probes are also good.
In the antibody step incubate both AP coupled anti-DIG (Roche) plus HRP coupled anti-FITC (Roche) together (if you used DNP in your RNA, use anti-DNP-HRP, Perkin-Elmer). Wash out antibodies and develop standard BM purple color for as long as you want. Rinse, then develop the tyramide counterstain as described from point 5 onwards. Following a nice long wash (2 days) photograph separately using both reflected light and fluorescence.
The overlay is done in Adobe PhotoShop as follows (Victor Gerth and Peter Vize)
- Copy green flourescent image to new image.
- Using the new image paste the green channel into the red channel.
- Fill the green channel with black.
- Adjust brightness & contrast to eliminate auto-fluorescence and preserve the staining. (suggest 25 brightness and contrast values)
- Desaturate bright field (BF) image.
- Adjust BF image contrast to darken stained area (contrast: -35)
- Convert BF image to grey scale and paste into green channel.
- Paste into blue channel.
- Invert the blue channel.
- Weaken blue channel to prevent washing out flourescent data (brightness:-40 and contrast:-6)
- Adjust red channel if the differentination is still weak. (suggest brightness: +16 contrast:+23.
- Adjust RGB channel to exagerate differences (brightness:-10 contrast:+12).
Papers and other sites: Davidson, L. A., and Keller, R. E. (1999). Neural tube closure in Xenopus laevis involves medial migration, directed protrusive activity, cell intercalation, and convergent extension. Development, 126:4547-4556
Zhou, X. and Vize, P.D. (2004). Proximo-distal specialization of epithelial transport processes within the Xenopus pronephric tubules. Developmental Biology 271: 322-338.
Davidson, Keller, and DeSimone (2004) Patterning and tissue movements in a novel explant preparation of the marginal zone of Xenopus laevis. Gene Expression Patterns Jul;4(4):457-66.
Lance Davidson's flourescent in situ methods page
Vize, P.D., McCoy, K.E., and Zhou, X. (2009). Multichannel wholemount fluorescent and fluorescent/chromogenic in situ hybridization in Xenopus embryos. Nat Protoc. 4(6): 975-983.